learning low-level vision feautres in ~10 lines of code
adam coates and colleagues have a string of very interesting papers where they propose using k-means to train convolutional networks. training the first layer boils down to about 10 lines of python code (thanks to sklearn’s implementation of k-means).
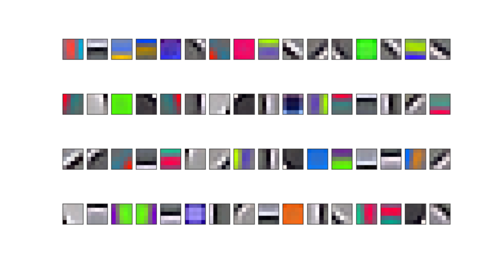
here are the filters i got by training it on the cifar-10 dataset:
and here are first layer filters from cuda-convnet trained on the same data (but in a supervised manner):
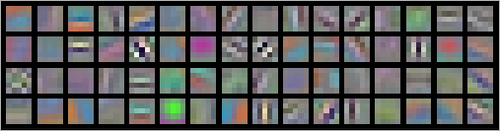
of course what matters in the end is the overall accuracy of the network, but at least qualitatively the filters look similar, and it’s pretty fun that you can get this sort of output from k-means.
here’s the code if you want to try it out yourself (and yes, that’s more than 10 lines, but most of it is just set up + loading data + displaying results):
import cPickle as pickle
import numpy as np

from matplotlib import pyplot as plt
from os.path import join
from sklearn.cluster import KMeans

# download data here: http://www.cs.toronto.edu/~kriz/cifar.html
with open(join('data','cifar-10-batches-py','data_batch_1'), 'rb') as f:
    data = pickle.load(f)

images = data['data'].reshape((-1,3,32,32)).astype('float32')/255
images = np.rollaxis(images, 1, 4)

# collect patches
patches = np.zeros((0,5,5,3))
for x in range(0,32-5,5):
    for y in range(0,32-5,5):
        patches = np.concatenate(
            (patches, images[:,x:x+5,y:y+5,:]), axis=0)
patches = patches.reshape((patches.shape[0],-1))

# normalize
mu = patches.mean(axis=0)
sigma = patches.std(axis=0) + np.ptp(patches, axis=0)/20.0
patches = (patches-mu[np.newaxis,:])/(sigma[np.newaxis,:])

# zca whiten
eig_values, eig_vec = np.linalg.eig(np.cov(patches.T))
zca = eig_vec.dot(np.diag((eig_values+0.01)**-0.5).dot(eig_vec.T))
patches = np.dot(patches, zca)

# k-means
NUM_FILTERS = 64
km = KMeans(
    n_clusters=NUM_FILTERS, n_jobs=1,
    random_state=0, n_init=1, verbose=True)
km.fit(patches)
filters = km.cluster_centers_.reshape((NUM_FILTERS,5,5,3))

# display
fig = plt.figure()
num_col = int(np.ceil(float(NUM_FILTERS)/4))
for i in xrange(NUM_FILTERS):
    ax = fig.add_subplot(4, num_col, i)
    filter_ = filters[i,...]
    filter_ -= filter_.min()
    filter_ /= filter_.max()
    ax.imshow(filter_, interpolation='none')
    ax.get_xaxis().set_visible(False)
    ax.get_yaxis().set_visible(False)